
On January 25, 2025, the Social Security Institution’s Communiqué on Healthcare Implementation (SUT) was revised, resulting in a significant increase in the medical examination copayments. The average copay at public health services providers rose from TRY 6.50 to TRY 30, while at private providers, it increased from TRY 15 to TRY 50. Then, on February 23, 2025, another revision was introduced, retroactively effective from January 15. This adjustment reduced the average medical examination copay at public healthcare providers to TRY 10. In this blog post, we analyze the effects of these recent changes on headline and core inflation indicators to gain a deeper insight into inflation trends.
The SUT revisions affect two items in the Consumer Price Index (CPI) health group: (i) the medical examination copay (public) and (ii) private hospital doctor's examination fee (within the scope of the General Health Insurance). The primary effect of the SUT revisions on CPI stemmed from the increase in the medical examination copay at public health service providers, as this adjustment was more pronounced. In contrast, the increase in the private hospital doctor's examination fee had a relatively smaller effect on inflation, given that the fee was already at a high level.
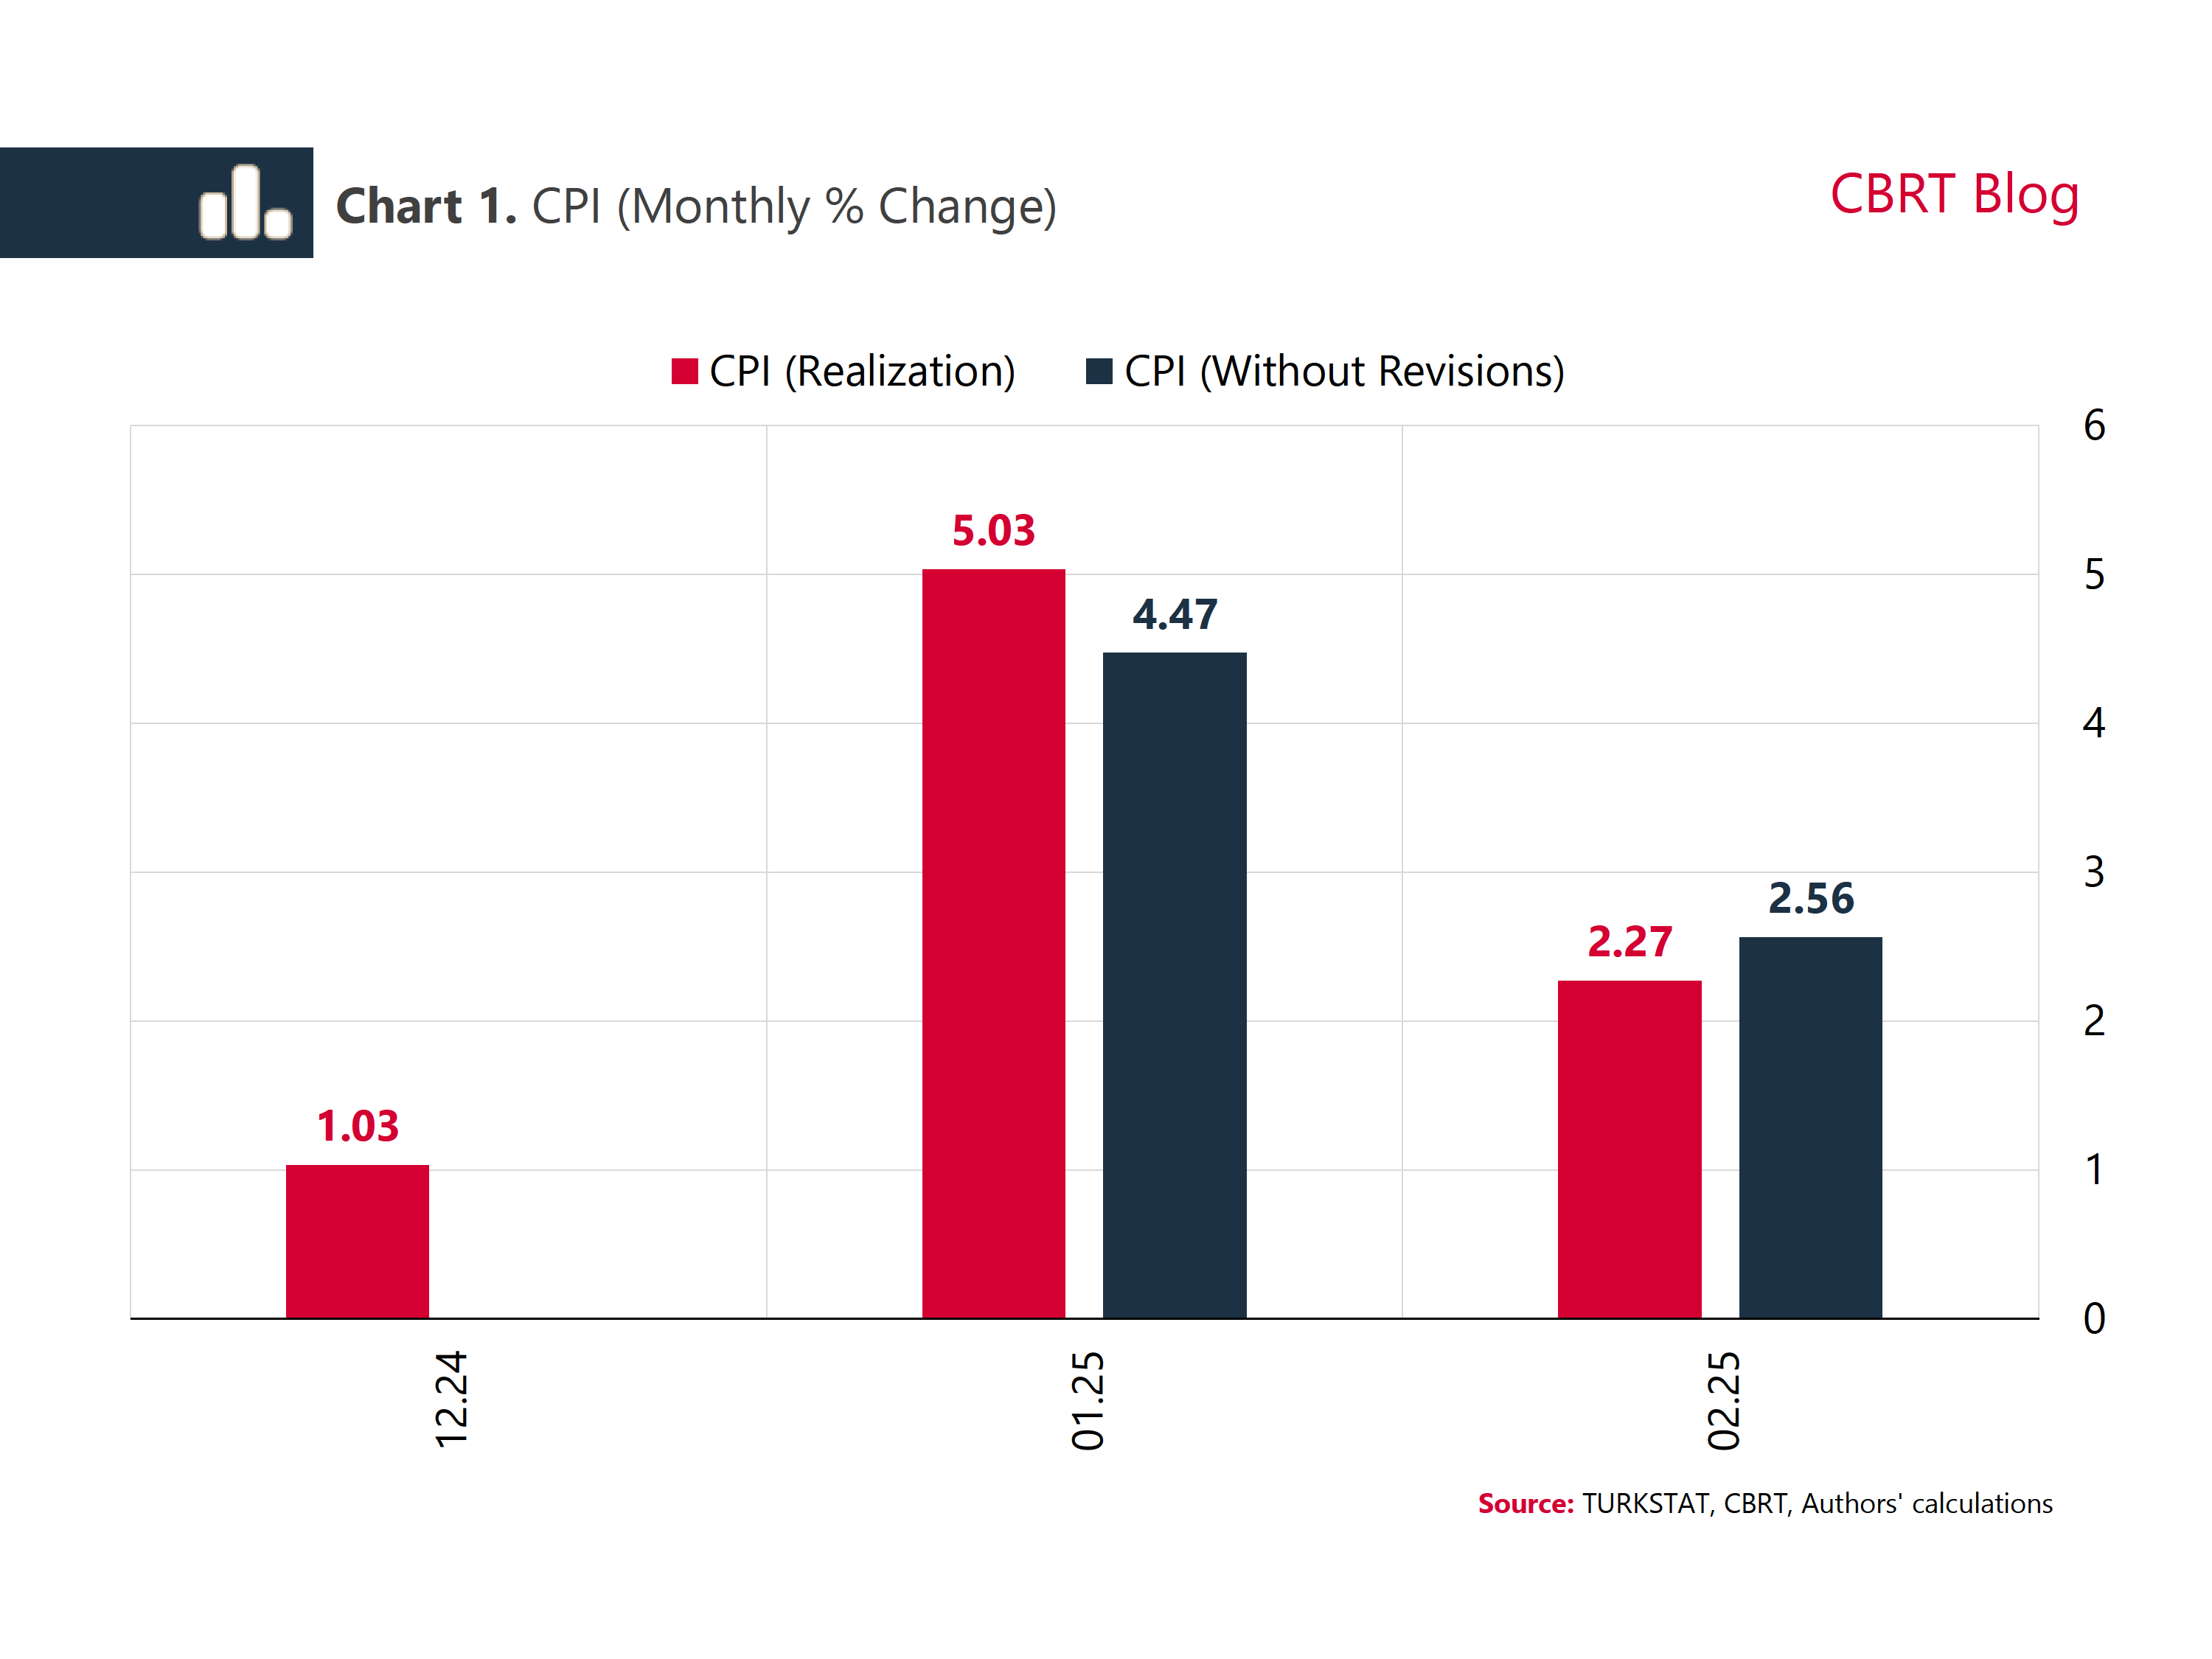
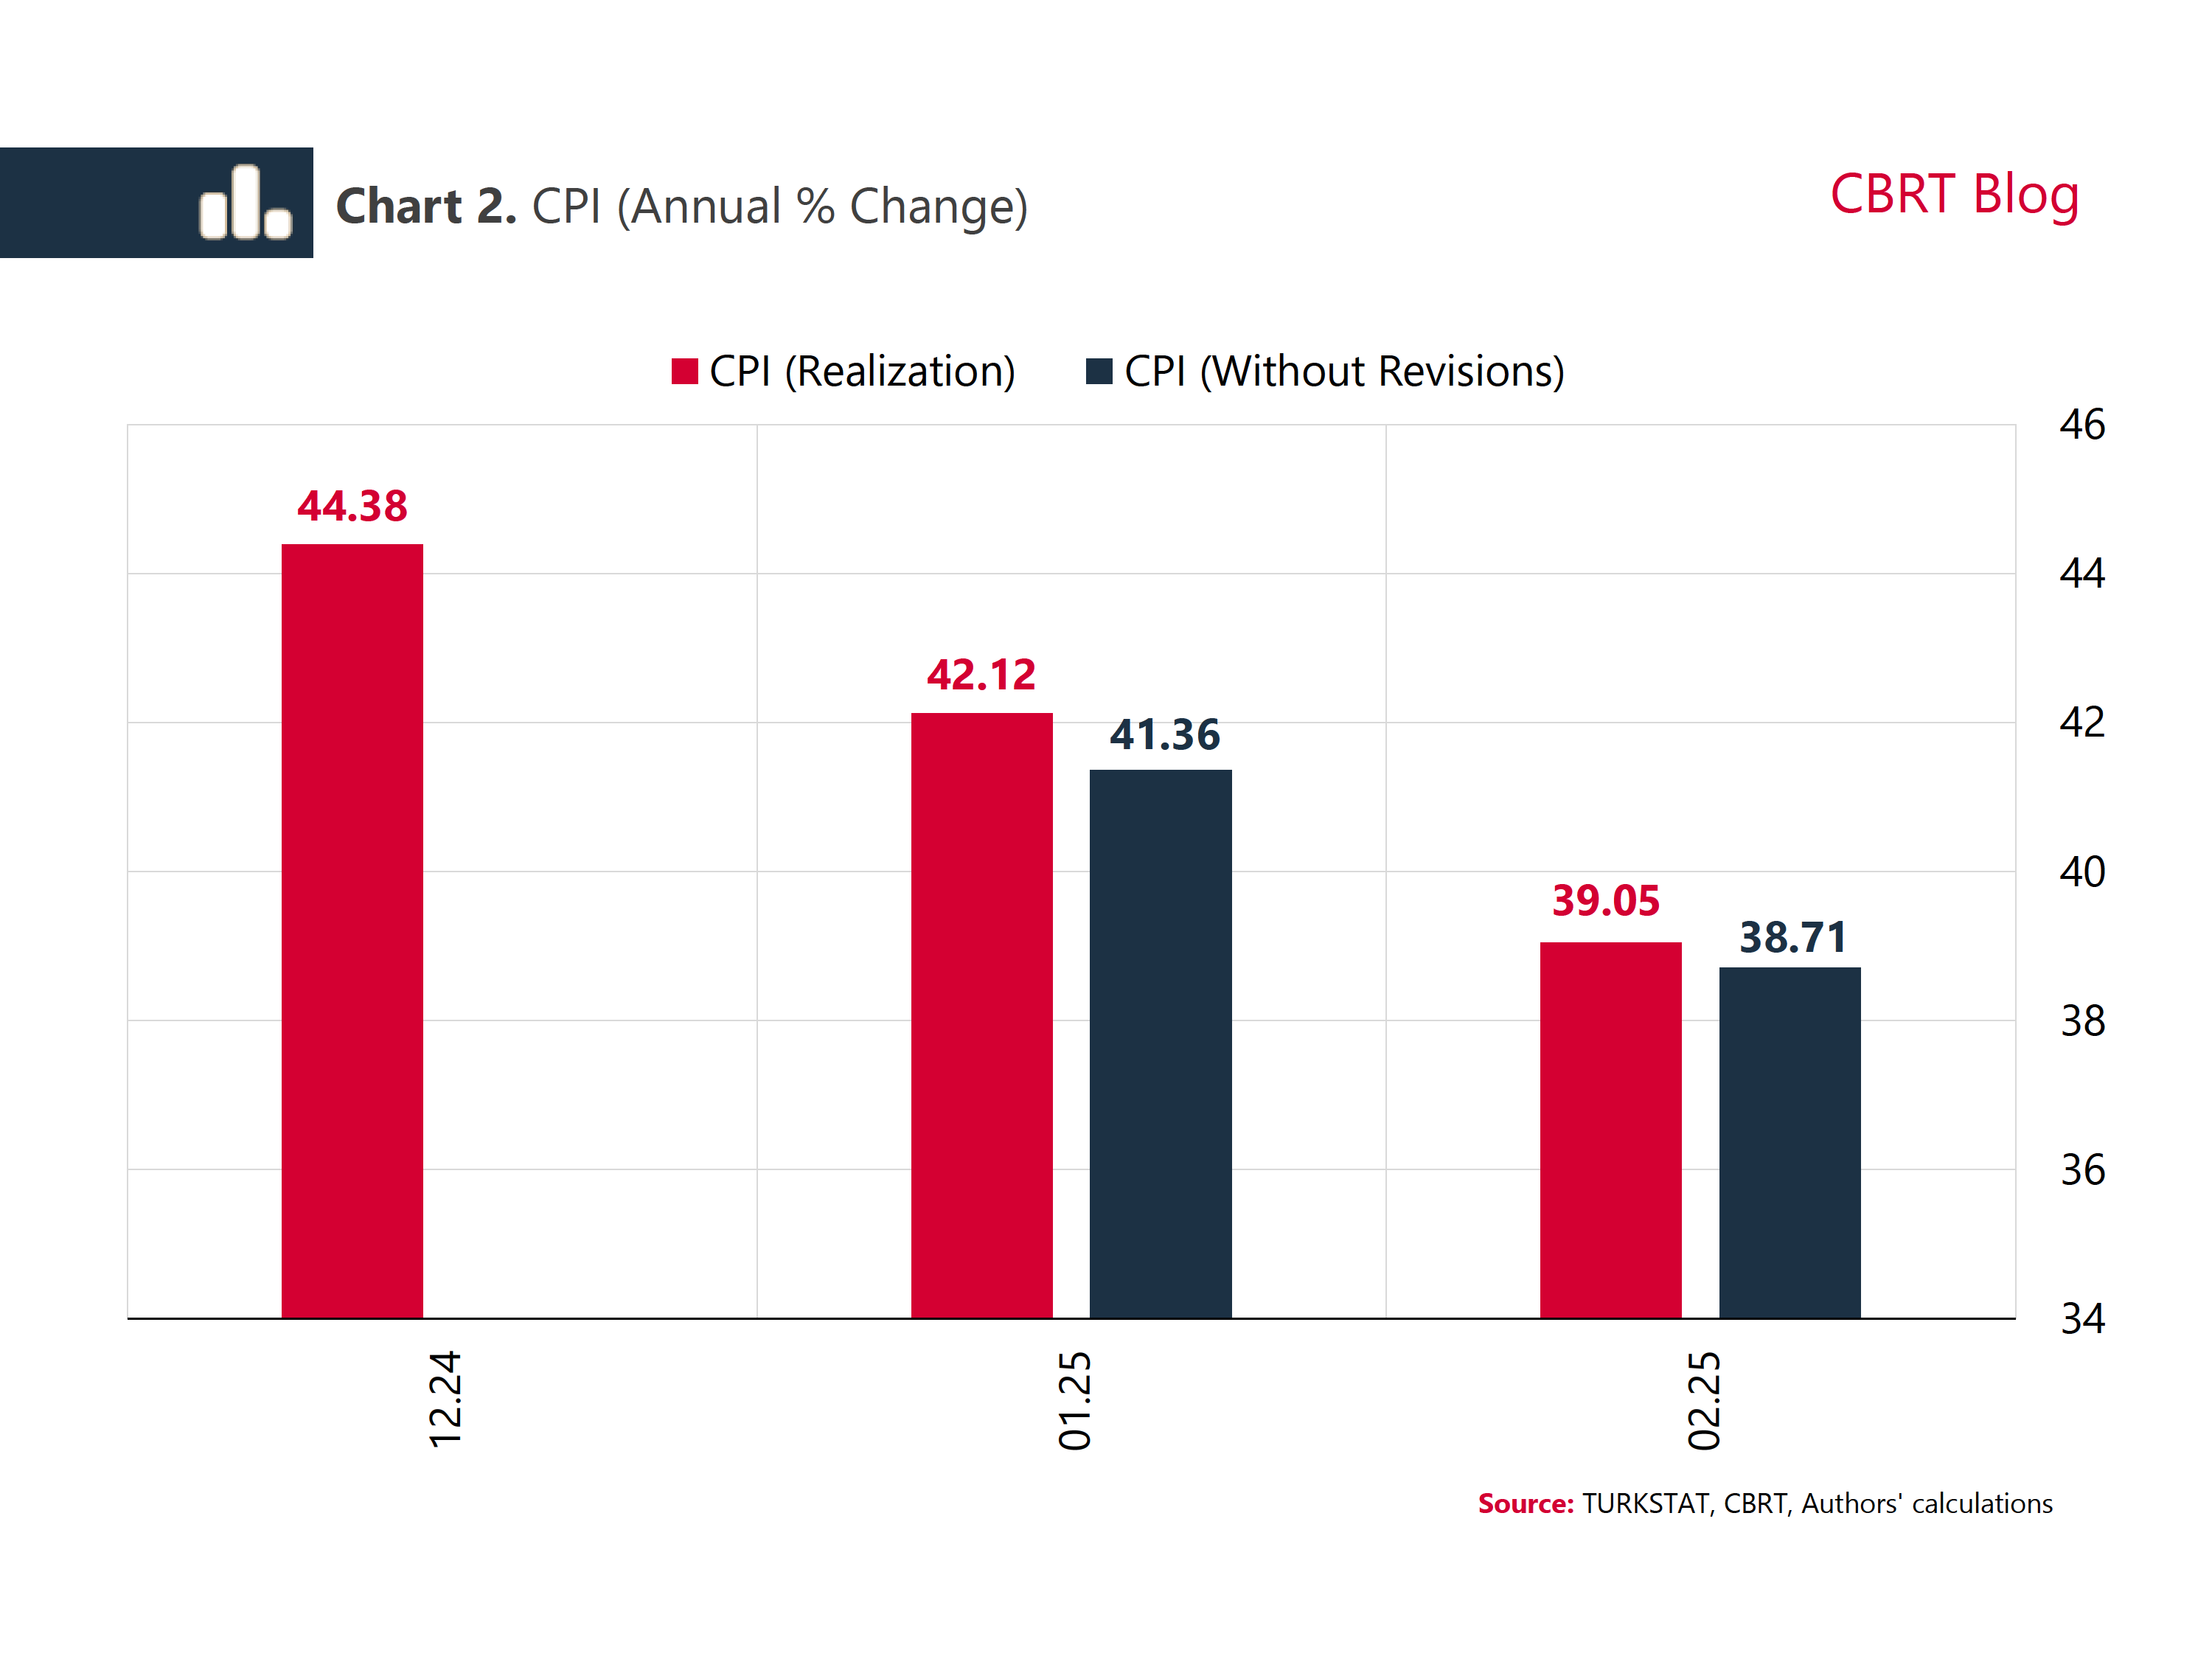
We evaluate the impact of these adjustments on inflation by comparing the actual CPI with a counter factual CPI that would have prevailed had there been no revisions. Our findings indicate that the adjustments resulted in a 56 basis points increase in month-on-month inflation for January, while they led to a 29 basis points decrease in February (Chart 1). The cumulative effect of the year-to-date SUT revisions on headline inflation amounted to a 76 basis points increase in January and a 34 basis points rise in February (Chart 2).
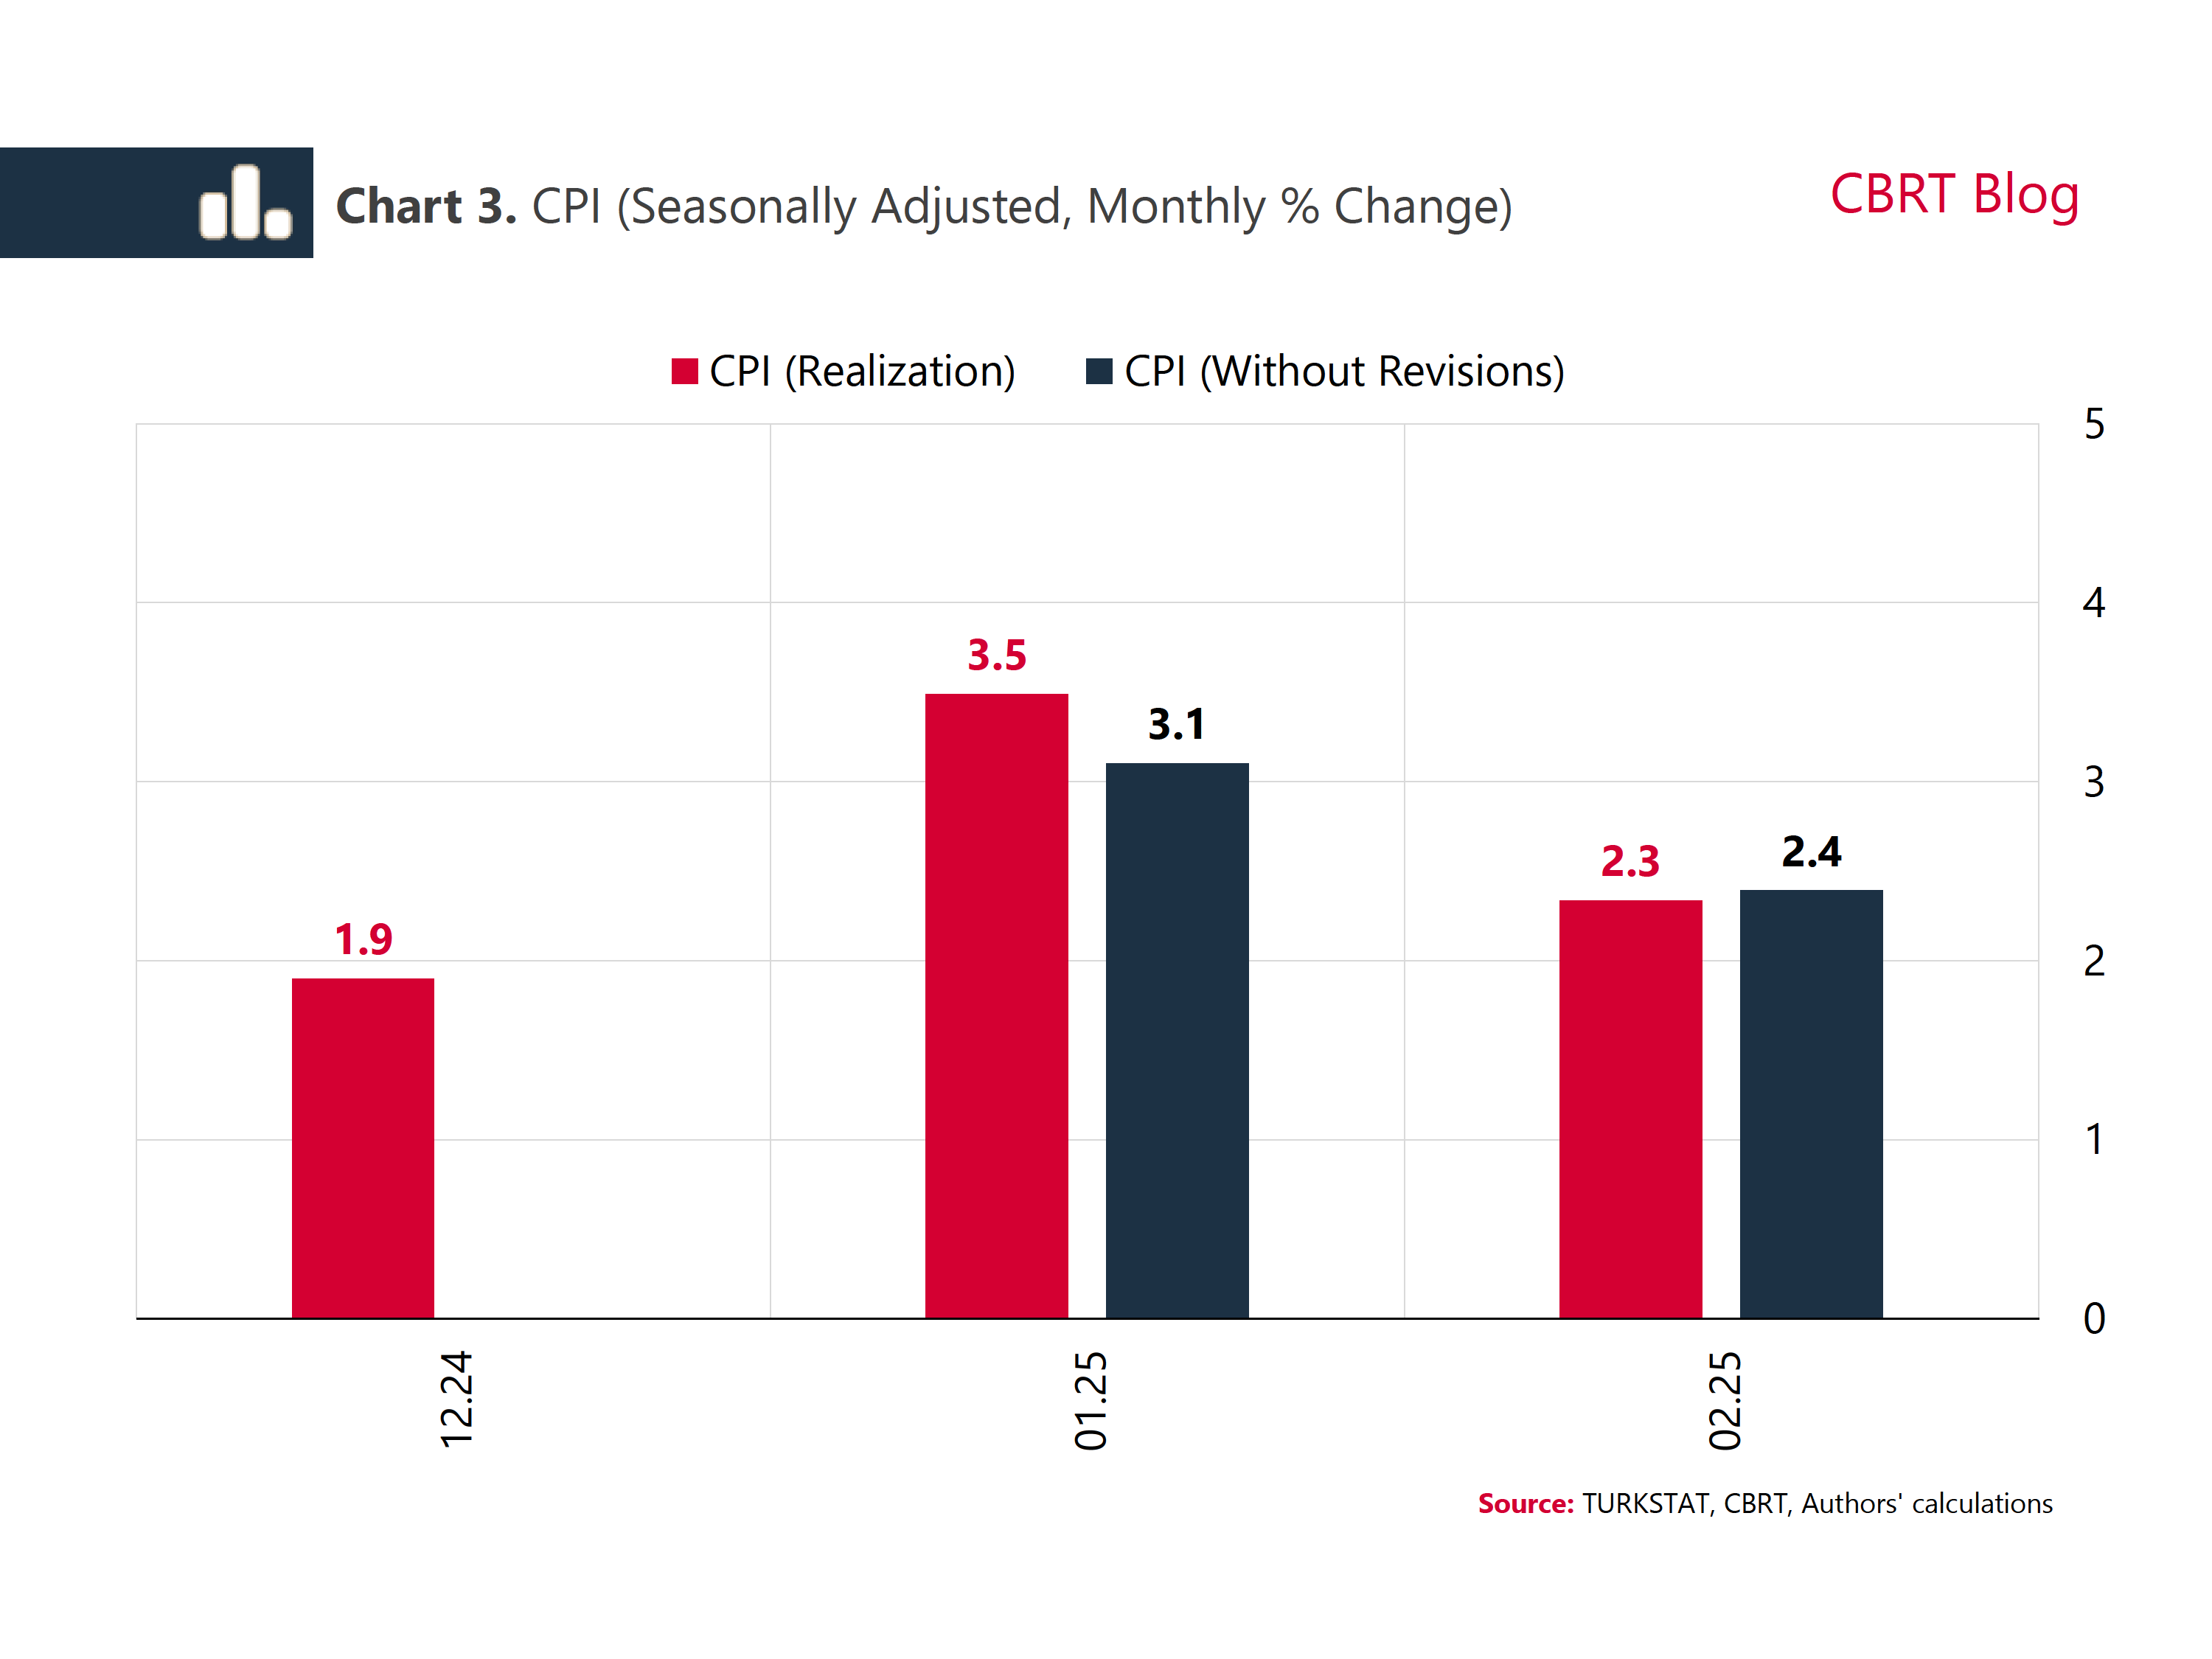
We estimate that the revision increased the month-on-month inflation in January by approximately 0.4 points in seasonally adjusted terms (Chart 3). As for core inflation indicators, it added about 0.6 points to the average increase in the B and C indices in January (Chart 4). However, in February, the seasonally adjusted monthly consumer inflation and the average of the B and C indices decreased by 0.1 points on the back of the revisions.

To deepen the analysis, we also examine the underlying inflation indicators, which offer valuable insights into the inflation outlook, as illustrated in Chart 5. By comparing the relevant figures for 2025 with the same period from the previous year —under the assumption that no revisions had occurred— we observe a notable slowdown in underlying inflation. Specifically, the underlying inflation indicators for February of this year averaged around 2.4%, down from 4.1% in February of the previous year. This suggests that the decline in annual inflation was driven primarily by the reduction in underlying inflation, rather than base effects.
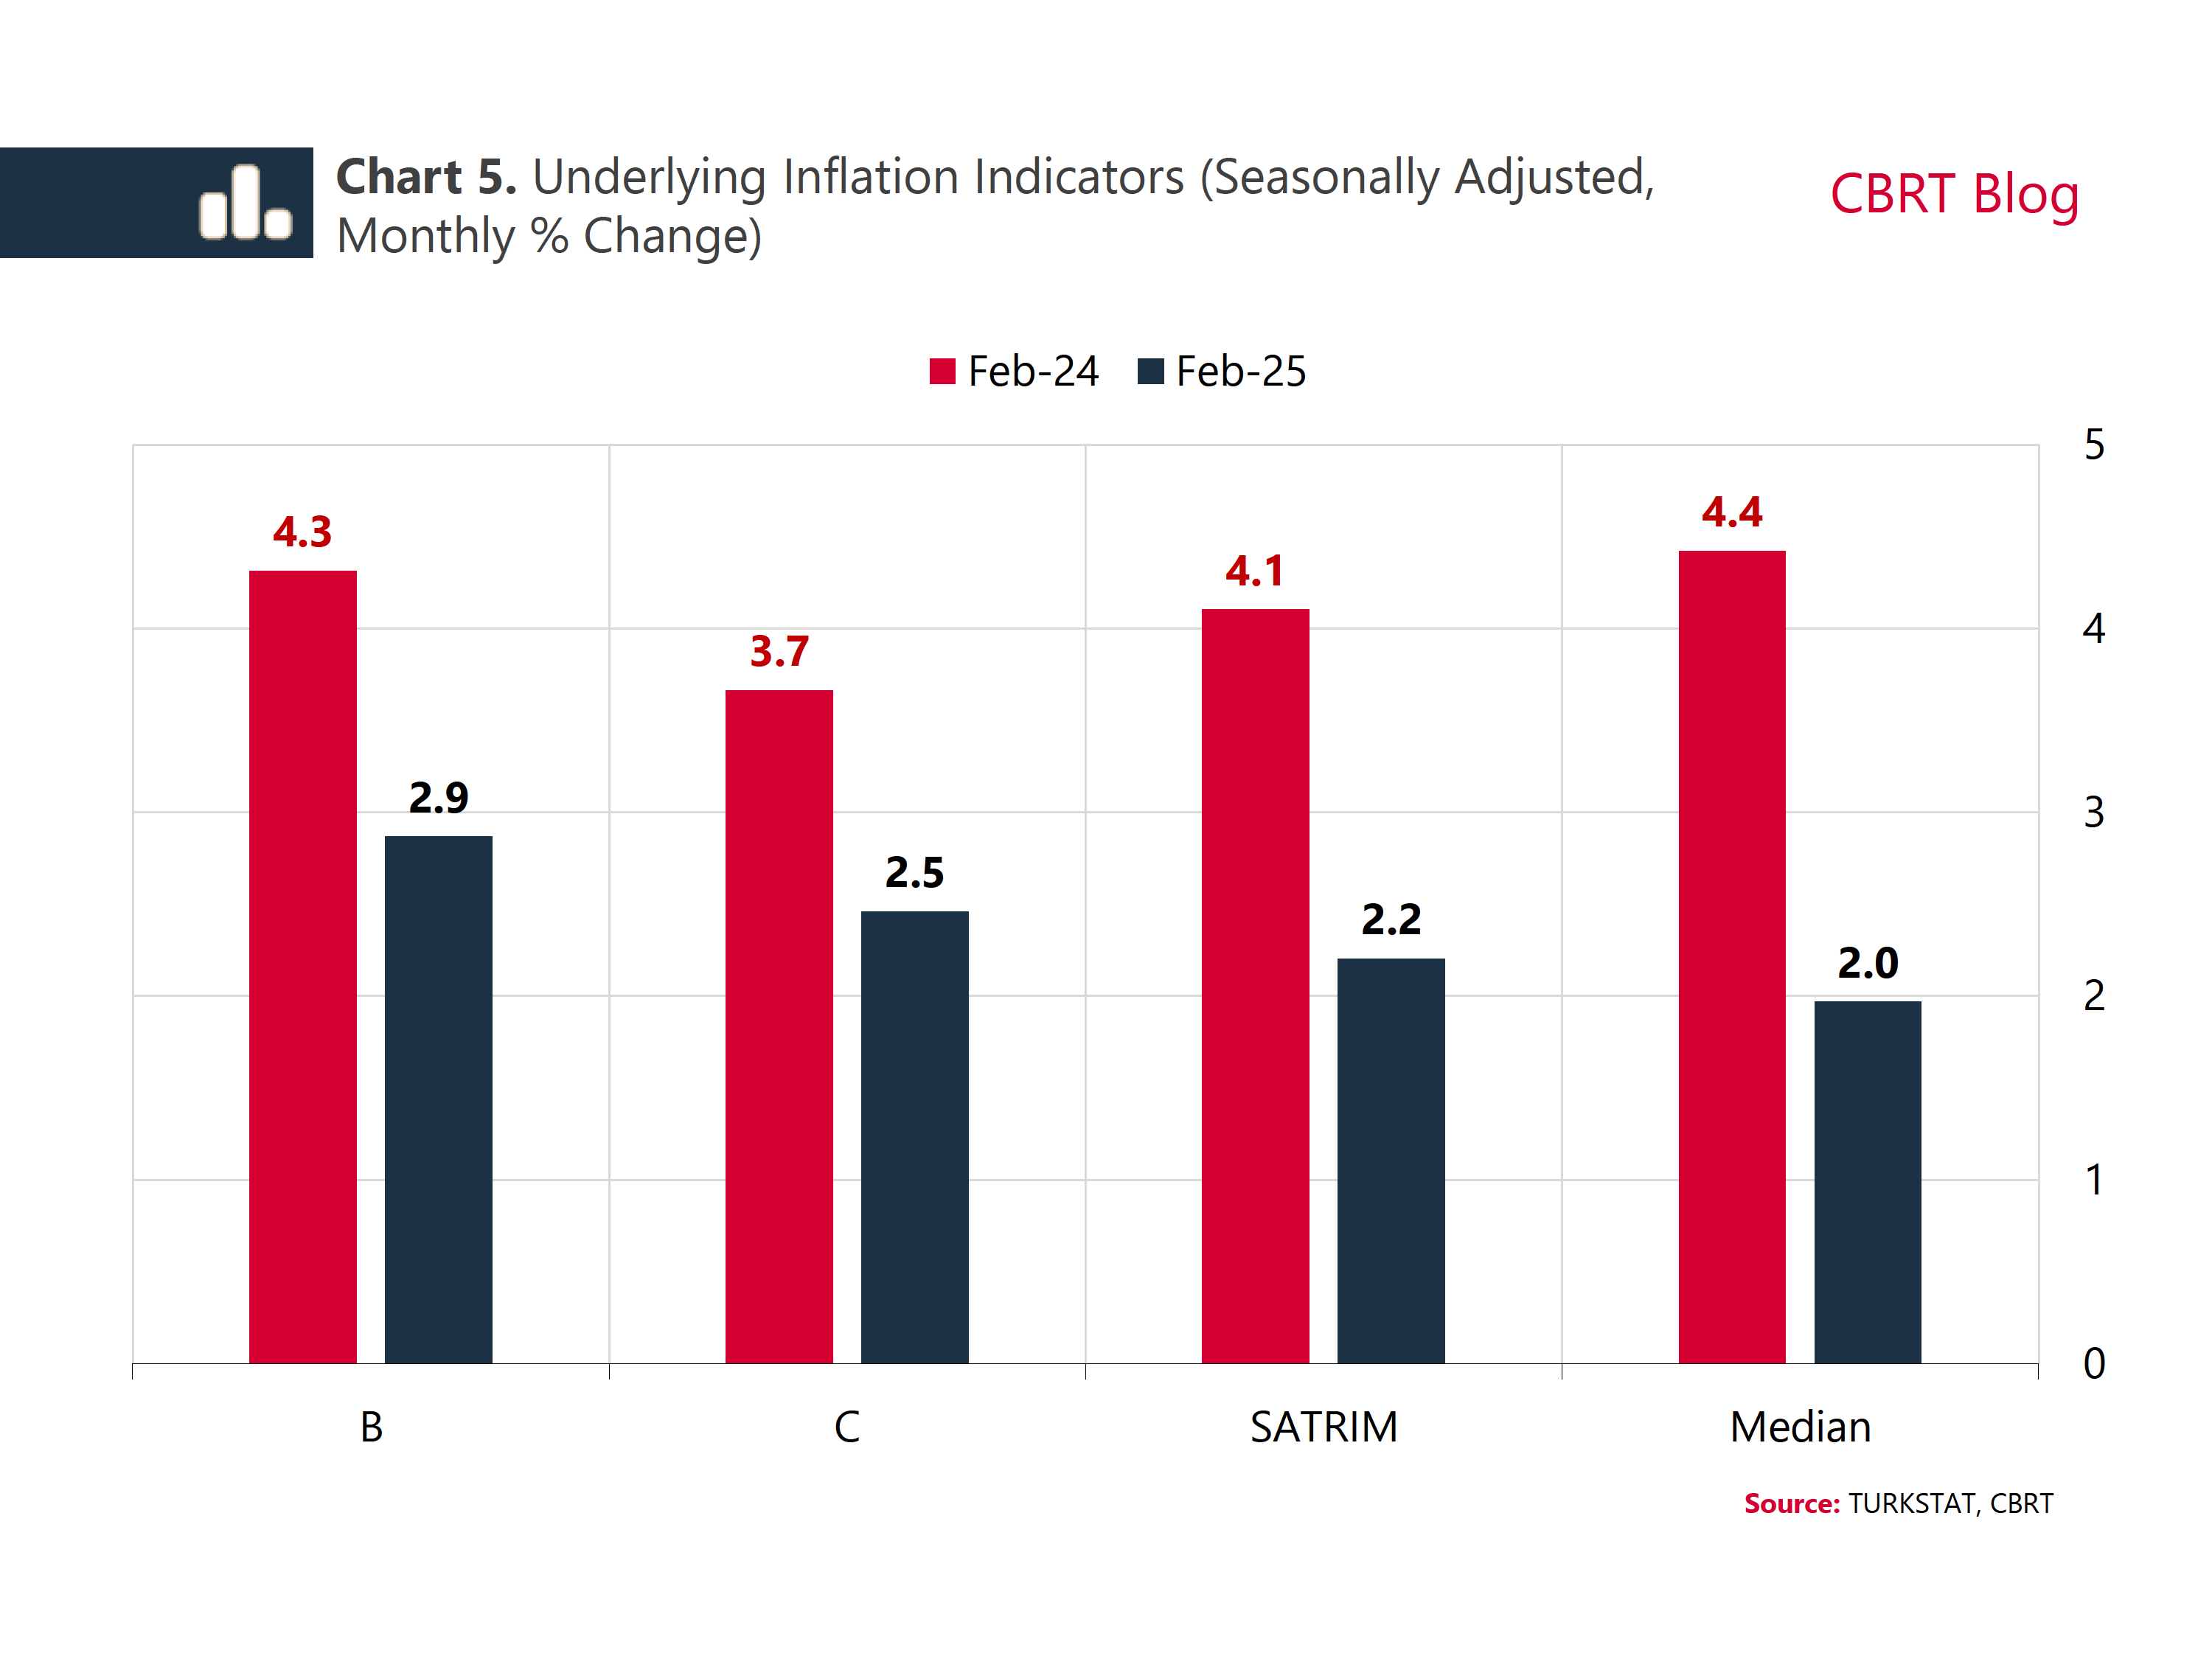
Note: February 25 is estimated for the scenario without revisions. For detailed information on the calculation of indicators, see Inflation Report 2024-IV, Box 2.5.
To sum up, the data suggest that the rise in both headline inflation and core indicators in January, driven by the rise in the medical examination copayments, was partly offset in February. Moreover, the slowdown in annual consumer inflation appears to be primarily driven by a decline in underlying inflation, even when excluding the impact of the SUT adjustment, which has only a temporary effect on inflation.